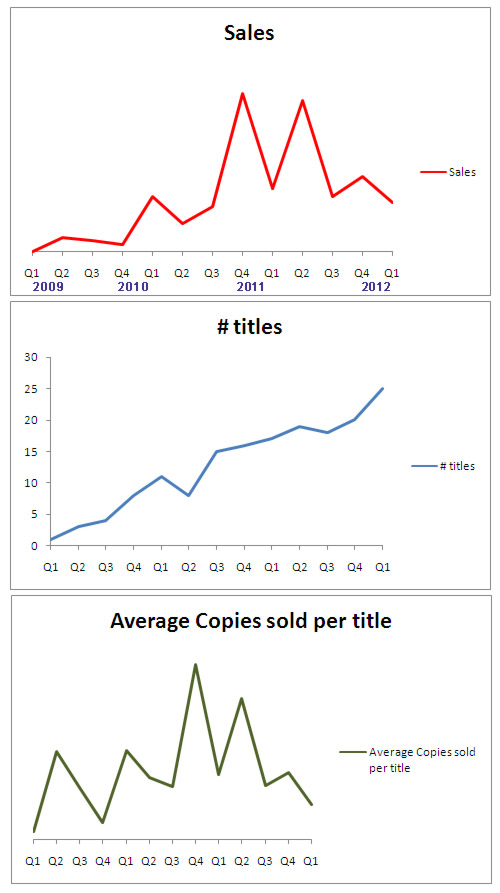
We're in the process of putting together our numbers and seeing how things are going. From this we've made some graphs. The first shows the number of books sold per quarter since 1 July 2009 through to 30 September 2012. We've left out sales of the limited editions and ebooks because they're kinda sorted differently.
The second graph shows the number of titles that have had at least 1 sale during a quarter. Last quarter 25 titles sold at least 1 copy.
The last graph shows the average number of copies per title sold during the quarter. It kind of shows that even though we've added more titles to our catalog, each title over the last 3 quarters has, on average, sold less.
So that's how things are going. In pictures. There's room for things to get better. Or worse.